

In this article, I plan to explain how, in my day-to-day practice, we use the Cumulative Flow Chart in Scrum while working within the SAFe framework
Let me start with a link to this article—in my view, it explains its purpose well in its standard form, and I recommend reading it before you continue with my post. Below I describe how we adapted it for a Scrum process (originally it is used in Kanban) and what problems it helps us solve when working in sprints.
Earlier, in my article on Burn Down Charts, I already mentioned that there we can see new work appearing and old work being burned down. The issue with a Burn Down Chart is that, unlike a Cumulative Flow Chart, it does not show User Stories moving through statuses. When we start observing status movement in a Cumulative Flow Chart, we begin to see day-to-day changes (a Burn Down Chart may stay unchanged for several days, and in some contexts that can be perfectly normal) and we can notice subtler problems.
Here is what this can look like over time (the diagram in the image is built from real data).
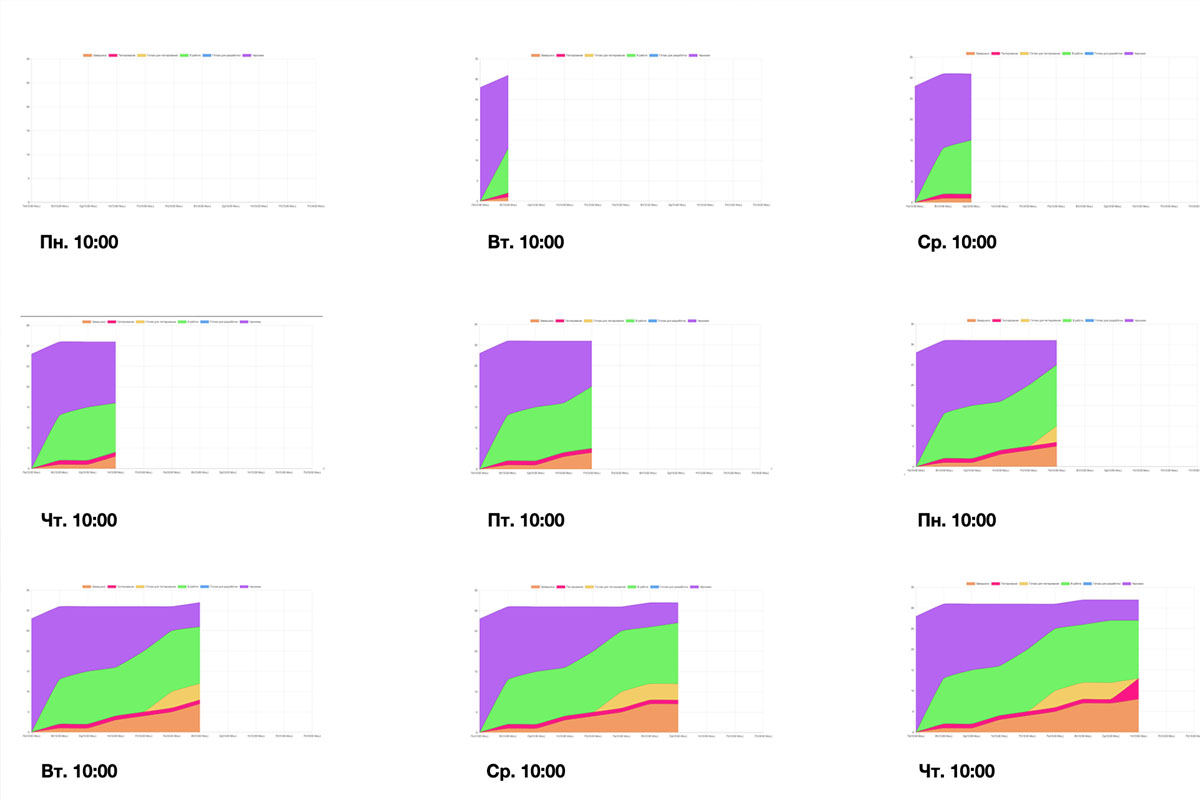
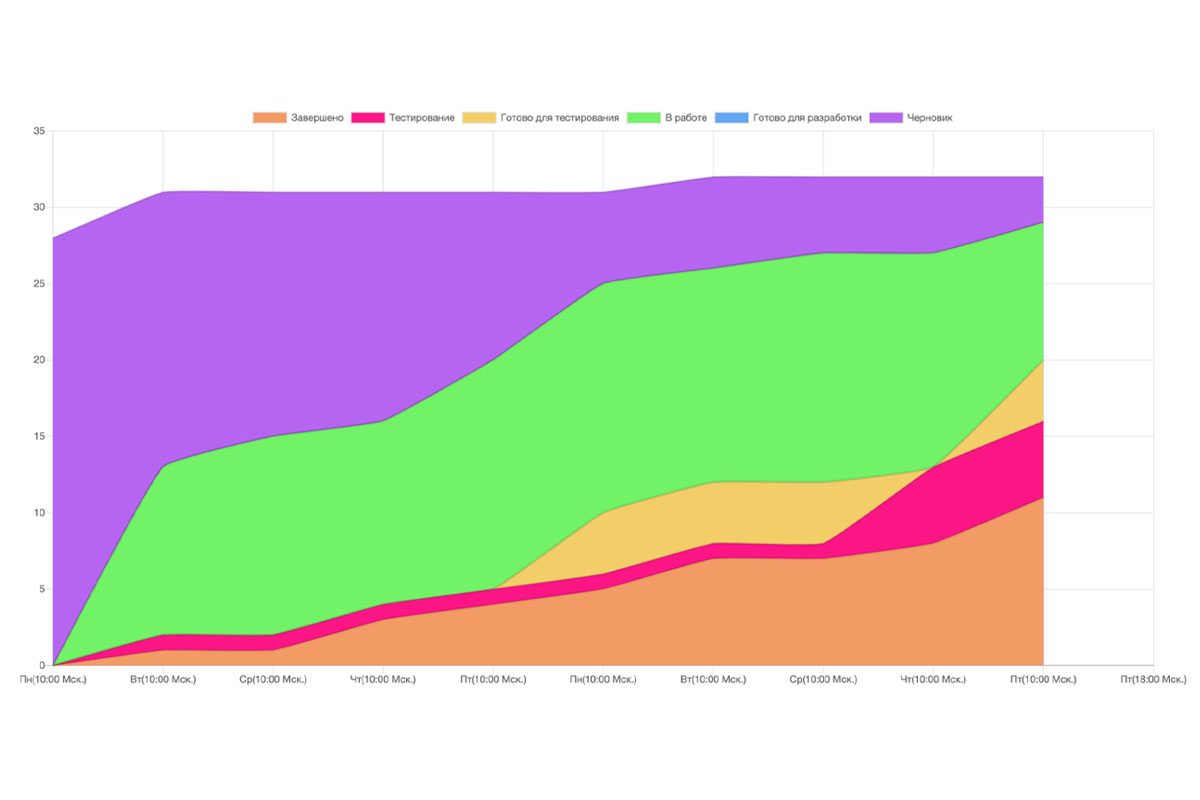
In this example, we can see the following
- For the first 7 days of the sprint, there is a very small amount of work in Testing, and it does not change
- User Stories move from DOR (here, this is the draft) into In Progress fairly evenly—this is good.
- As with a Burn Down chart, we can see that, based on the trend, the User Stories will not be completed by the end of the sprint
Taken together, these three observations lead to the following conclusion. Even at early stages (around the second or third day of the sprint), the Scrum Master should have paid attention to the "Testing" band, which is too thin and does not change for a long time (and verified the reason). One possible explanation is that the work ready for testing cannot be tested for some reason; but then that means the testers are idle, so at the very least it is worth listening to them more carefully at the next stand-up.
In terms of practical usage, for example, I post all metrics in the team chat every day before the stand-up and mention the whole team.
In general, it is worth remembering that metrics still need to be interpreted correctly. You need to be able to spot systemic problems when they really exist, and not treat as problems things that, in your context, may even be a positive sign